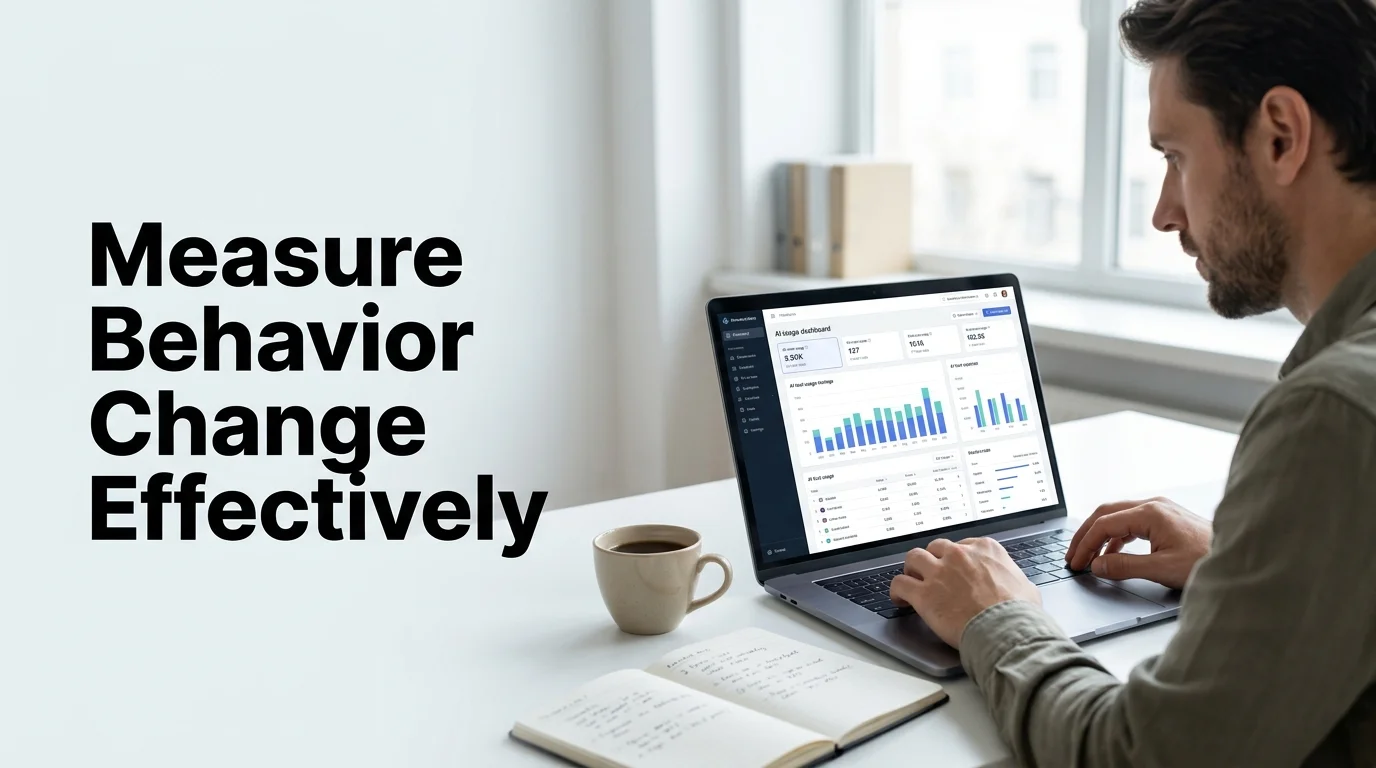
A training program that nobody measures ends with a feeling, not an answer. Here is what to track so you know whether AI training worked.
In brief
- Measure AI training by behavior change. Logins, attendance and hours of content consumed tell you little.
- Track three levels: adoption (are people using AI on the right tasks), quality (is the output good enough), and business impact (is it saving time and adding capacity).
- A monthly three-question survey, quarterly one-on-one conversations, and a semi-annual skills gap review are enough for most small businesses.
- An internal AI operations lead should run the measurement, not the founder, or it will not happen consistently.
- Start with three to five core metrics. A dashboard with twenty metrics tells you nothing about what to do next.
- Two hours per week recovered per person is over one hundred hours per year, which is a return you can defend.
Track behavior change, not completion rates, or you are measuring the wrong thing
Most small business AI training programs end without any clear picture of whether they worked. The founder spent time and money on training, some team members appear to be using the tools, and the general sense is that things are better than they were. That general sense is a feeling, and it is often wrong.
Without measurement, AI training investment cannot be defended, optimized, or scaled. When the next budget cycle comes around, training programs that cannot demonstrate results are the first to be cut. More importantly, without measurement, the specific problems that are limiting adoption stay invisible and unfixed.
What Measurement Is Actually For
Measure AI training outcomes to understand what is working, identify what is not, and make specific improvements that increase the return on the investment already made.
The purpose determines what you measure and how you use the data. Measurement aimed at justifying the program to skeptics tends toward vanity metrics: number of licenses activated, training sessions attended, hours of content consumed. Measurement aimed at improvement tends toward behavioral metrics: how often team members use AI for relevant tasks, whether outputs meet quality standards, and whether time savings are materializing in specific workflows.
Build your measurement system around the second category.
The Three Measurement Levels
AI training outcomes operate at three levels, and all three tell you something different.
| Level | Question it answers | Example metrics |
|---|---|---|
| Level 1: Adoption | Are people using AI as part of how they work? | Usage frequency, task coverage, time to first AI use |
| Level 2: Quality | Is AI-assisted output meeting the standard? | Output quality scores, error rates, editing time |
| Level 3: Business impact | Is this producing measurable value? | Time savings by workflow, throughput, consistency |
Level 1: Adoption Metrics
Adoption metrics tell you whether the training changed behavior. They answer the question: are people actually using AI as part of how they work?
Usage frequency. How often are team members using AI tools for relevant tasks? Track this by role, not just in aggregate. An average adoption rate of sixty percent looks very different if three people are using AI daily and seven people are using it never.
Track usage frequency monthly. A simple self-reported survey with four options, never, rarely (monthly or less), sometimes (weekly), and regularly (daily or near-daily), is sufficient for most small businesses. The goal over the first six months is to move the distribution toward regular usage for roles where AI has clear applications.
Task coverage. Which tasks are team members applying AI to, and which are they still completing manually? This tells you whether training is translating into workflow integration or staying a set of personal productivity experiments.
Document the target tasks for each role at the start of the training program. Measure quarterly which of those tasks are now regularly AI-assisted versus still handled manually.
Time to first AI use. For new hires, track how long it takes from their start date to their first regular use of AI tools. This metric reflects how well your onboarding and documentation support fast adoption, and it tends to improve as your prompt library, training materials, and documentation mature.
Level 2: Quality Metrics
Quality metrics tell you whether AI-assisted work is meeting the standards you expect. They answer the question: is the output acceptable, and what does review and editing look like?
Output quality scores. For tasks with consistent deliverables, have a reviewer score AI-assisted outputs on a simple rubric before and after training. A first-draft client proposal, a meeting summary, a process document, each can be evaluated against defined quality criteria. Track whether scores improve over time and whether AI-assisted outputs are reaching approval-ready quality in fewer editing rounds.
Error rates. Track how often AI-assisted outputs contain errors that require correction before delivery. This is particularly important for customer-facing communications and data-driven reports. As team members develop better prompting skills and output review habits, error rates in AI-assisted work should decline.
Editing time. Measure the time between an AI-generated first draft and the final approved output. If editing time is not declining as team members build skill, investigate whether the problem is prompting, output review process, or expectations about what AI should produce.
Level 3: Business Impact Metrics
Business impact metrics connect AI training outcomes to operational results. They answer the question: is this producing measurable value for the business?
Time savings by workflow. For each workflow where AI has been integrated, compare the time required before and after integration. A reporting workflow that previously required four hours and now requires ninety minutes represents concrete, defensible value. Aggregate these savings across the team monthly.
Throughput improvement. Can the team handle more volume without proportional increases in headcount or hours? AI training that is working should show up in the team’s capacity to process more work at the same quality level. This is the metric that matters most to growth-focused founders.
Consistency improvement. AI-assisted work tends to be more consistent than fully manual work because the baseline quality of outputs is standardized by good prompts. Track consistency in customer-facing outputs over time as a measure of whether AI integration is improving the reliability of delivery.
How to Measure AI Performance and Training Effectiveness
Two questions get mixed up here. How to measure AI performance is about the tools: are the outputs accurate, and how much editing do they need? How to measure AI training effectiveness is about the people: did the training change how they work?
Use the same three levels for both. Adoption shows whether people use the tools. Quality shows whether the work holds up. Business impact shows whether the business gained anything. If you can only track one measure per level, pick usage frequency, editing time, and hours saved per workflow.
For AI-enabled training, where AI helps deliver the training itself, add one more check. Compare how long it takes new hires to reach their first regular AI use before and after you adopt it.
How to Quantify Training Effectiveness
Quantifying training effectiveness comes down to a before and after comparison on a few workflows. Record the baseline before training starts, then measure the same thing monthly.
Here is a hypothetical example. A proposal workflow takes four hours before training and ninety minutes after. If the team writes six proposals a month, that is 15 hours recovered. Multiply by the loaded hourly cost of the people involved and you have a dollar figure you can defend.
To assess whether a training program worked, compare four numbers against the baseline: usage frequency, editing time, error rate, and hours saved. Enterprises layer on dashboards and formal ROI models to measure AI success at scale. A team of 5 to 20 does not need that. A simple spreadsheet and a named owner do the job.
Building a Simple Measurement System
A measurement system for a small business does not require sophisticated tooling. It requires a cadence, a few defined metrics, and someone responsible for collecting and reviewing the data.
Monthly: Run a three-question team survey on usage frequency, tool satisfaction, and current friction points. Review output quality on a sample of AI-assisted deliverables. Update time tracking on key workflows.
Quarterly: Conduct individual conversations with each team member about their AI usage, what is working, and where they are still defaulting to manual processes. Calculate aggregate time savings and compare to the same quarter in the previous period. Identify the two or three workflows where adoption is lagging most and investigate the specific barriers.
Semi-annually: Run a gap analysis to assess whether the skills required for each role have evolved and whether the team’s current capability matches those requirements. Refresh training plans based on what the data shows.
The person running this system should be the internal AI operations lead, not the founder. When measurement is a founder responsibility, it tends not to happen consistently. When it is a designated team member’s responsibility with a defined cadence, the data accumulates and becomes useful.
What the Data Should Tell You
After three months of measurement, the data should give you clear answers to four questions.
Which team members are using AI regularly and which are not? If usage is concentrated in two or three individuals, the barrier sits in the adoption support structure for the rest of the team.
Which workflows have been successfully AI-integrated and which have not? Workflows with low AI usage three months into a training program usually have a structural barrier: a process that is not documented, a prompt library that does not cover this workflow, or a data handling concern that has not been resolved.
Are outputs getting better or staying the same? If output quality is not improving with AI assistance, the problem is likely in training, specifically in how team members prompt and review outputs.
Is the time investment paying off? If you can trace two hours per week per team member in recovered time, that is over one hundred hours per year per person. For a team of eight, that is a meaningful operational return. If you cannot trace time savings, the workflows being AI-assisted may not be the right ones.
The Measurement Trap to Avoid
The most common measurement mistake in small business AI training is counting access and ignoring behavior. Confirming that everyone has a login, attended the training session, and knows how to open the tools tells you almost nothing about whether the training is producing the outcomes you intended.
The second most common mistake is measuring too many things. A dashboard with twenty metrics is no more useful than no dashboard, because it is not clear which numbers matter or what to do when they go in the wrong direction. Start with three to five core metrics, maintain them consistently, and add complexity only when the basic metrics are understood and acting on.
Measure what is happening. The data tells you where to focus next.
Questions founders ask
How do you measure AI training effectiveness?
Look at what people do after the training, not whether they attended it. Track how often each role uses AI on its target tasks, whether the output meets your quality bar, and how much time each workflow saves. If those three are moving, the training is working.
What is the difference between vanity metrics and useful AI training metrics?
Vanity metrics count access: licenses activated, sessions attended, content watched. Useful metrics count behavior: usage on real tasks, error rates, editing time, and hours saved. Everyone having a login tells you almost nothing.
How often should a small business review AI training results?
Monthly for a quick survey and a sample of outputs. Quarterly for one-on-one conversations and a time savings total. Every six months for a skills gap review and a refresh of the training plan.
Who should own AI training measurement?
A designated team member, usually the internal AI operations lead. When the founder owns it, it gets skipped the first busy month. A named person with a set schedule keeps the data coming in.
What should you do if usage is stuck with two or three people?
Treat it as a support problem. Look for the structural barrier: an undocumented process, a gap in the prompt library, or an open question about data handling. Fix that and usage tends to spread.
How do you quantify training effectiveness?
Take a baseline on a few workflows before training, then measure the same things monthly. Compare usage frequency, editing time, error rate and hours saved. Multiply hours saved by the hourly cost of the people involved to get a dollar figure.
How do you measure AI performance in a small team?
Sample real outputs each month and score them against a simple rubric. Track the error rate and how long the editing takes. If editing time keeps falling, performance is improving.
Why does AI spending so often fail to pay back?
Usually the tool works and the habit never forms. People drift back to the old way, nobody checks whether usage changed, and the savings never show up in the numbers. That is what the measures in this post are for. They show whether behavior changed before you judge the tool.
Related reading: AI Team Adoption: Why Most Small Business Implementations Fail | How to Run an AI Training Pilot Program in a Small Business
Ready to build a training program with accountability built in from day one? Explore AI training programs for small businesses.